
You are interested in comparing lowest and highest data points used to plot a dose-response curve in 2 different columns. It would be useful to sort data by the lowest and highest response, but if you check the box ‘’data’’ in the "customize your report" interface, you get a value for each point in the same column and can not sort them.
In addition to showing the raw data for for each curve fit, there are calculated properties available under the
Customize your report menu. Click "all" to display all of them for your Dose-Response protocol, or individually select just the ones of interest: there is a separate check-box for minimum (Baseline response), maximum (Maximum response) and Span. These will give you what you're looking for- sortable columns of the lowest and highest values, as well as the range between them (span).
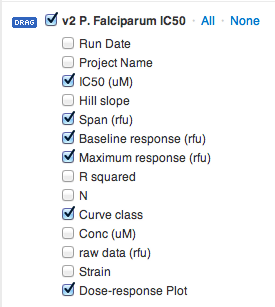 While we're on the subject, you can also look at Hill slope, R2, and n of each dose-response fit.