
If you are performing High Throughput Screens (HTS), you will likely want tools to QC data before making any other decisions. There are several statistics that are useful in determining how well a given plate or compound performed in the screen. There are three "z's" calculated automatically when plate and control information are uploaded to CDD together with protocol readout data (see training guide Lesson 3 for details).
Z'-factor
The Z’ (Z-prime) statistic is widely used as a measure of assay quality, showing the separation between the distributions of the positive and negative controls. The Z′-factor describes how well separated the positive and negative controls are, and indicates likelihood of false positives or negatives. Values between 0.5 and 1 are excellent, values between 0 and 0.5 may be acceptable, and values less than 0 indicate the assay is unlikely to be usable in a high-throughput context.
On the run page we display a Z′-factor for each plate, as well as one for the Protocol as a whole. CDD color-codes and highlights any questionable or poor Z' factors on the Data Summary sub-tab of a run. Highlighting is likewise applied to all columns on the Run Summary page where we show a Mean+/- StDev, as follows:
- Plate mean > 1 standard deviation away from the protocol mean is highlighted yellow.
- Plate mean > 3 standard deviations away from the protocol mean is highlighted red.
- Plate standard deviation > 2 times the protocol standard deviation is highlighted yellow.
- Plate standard deviation > 3 times the protocol standard deviation is highlighted red.
On the heat-map display, the Z’-factor will be calculated per plate, and displayed to the right of the heat-map if the positive and negative controls are assigned. If controls are not assigned, the Z’-factor will remain blank. You will be able to mine by the Z’-factor after selecting the specific protocol readout definition which contains the plate data.
Z’-factor is calculated as follows: 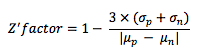 where
where
σp is the standard deviation of the positive control
σn is the standard deviation of the negative controls
μp is the mean of the positive control
μn is the mean of the negative control.
z Score
Standard score, or z-score is the number of standard deviations from the mean for each readout value. CDD automatically calculates z-scores on heat-maps, and it may also be included in readout normalization during protocol definition. This statistic is calculated for each sample well on each plate, and can be based on sample mean or negative control mean. Z-score value determines the heat-map color of the well, in the absence of plate or run controls.
z-score is calculated in one of two ways: 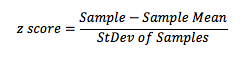 where Sample mean and Sample standard deviation refer to all test wells, and do not include any controls.
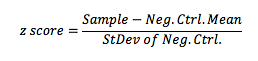 where Neg. Ctrl. Mean and StDev of Neg. Ctrl. refer to the Mean and Standard Deviation of the negative control wells.
The scope of the z-score calculation may be per plate - where mean and standard deviation are computed for each plate individually, or per run - where all plate data in a run is aggregated. The aggregation level is selected when defining the normalization of a readout definition.
Z Factor
The Z-factor is used to compare the mean and standard deviation of test samples to the positive control. Z-factor will be calculated per plate, and displayed to the right of the heat-map only if positive control is assigned.
Z-factor is calculated as follows: 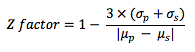 where
where
σp is the standard deviation of the positive control
σs is the standard deviation of sample wells
μp is the mean of the positive control
μs is the mean of the sample wells.
A Thought On Background Subtraction
CDD reviewed Robert Copeland's book on enzyme inhibitors, and found where he defines percent inhibition, and his formula uses "signal background" instead of "positive control" ; however, Copeland is using signal background as a synonym for positive control. Basically, whichever sets of wells used as "positive controls" and "negative controls" for statistics (such as Z' factor), the same sets of wells should be used when calculating percent inhibition/activation/viability. This makes sense, in light of what the Z' factor is supposed to represent. In conclusion, the calculations in CDD Vault do currently perform all the necessary calculations for removing background, though the naming conventions used are not the same as Copeland's.
Copeland, Robert A. Evaluation of Enzyme inhibitors in Drug Discovery: A Guide for Medicinal Chemists and Pharmacologists. Part of Methods of Biochemical Analysis – Volume 46. 2005. Wiley and Sons, New Jersey.
Outlier removal
Heat-maps may be used to inspect data in individual wells, and to mark them as outliers. Simply click on the well to view the details in a pop-up. In the pop-up, notice a red flag next to the data points - click on the red flag to mark the well as an outlier.
Any dependent calculations in the well will automatically become marked as outliers. For example, you can toggle your heat-map view between the raw data (RLU) and % inhibition, any data in the well will be marked as an outlier. The outlier status will be visible from all other data views, such as on the search results, or in the Run Data tabs, letting other people know that this particular data point is not to be trusted.