
In this lesson we will go over the steps to import single-point screening (assay) data from an HTS screen of a compound library. We will assume that the compound library was previously registered in the CDD Vault, so that we need to link data to the molecules based on the plate and well information. We will import raw data from the reader, and perform data normalization and QC directly in CDD after import. We will start with building a protocol to capture the data, prepare a raw data file including the plate maps, then import and review the results.
If you rather want to watch how to do this, you can find a shortened version as YouTube video on our CDD Academy channel:
Protocol set-up
Any type of biological, or other, non-structural molecule associated data, are stored inside protocols, and runs of protocols. The set-up described in this lesson is focused on primary data from large-scale HTS plated small molecule libraries. However, you can create protocols for other types of biological data, such as Dose-Response studies, enzymatic and cell-based assays, in vitro and in vivo ADMET and TOX screens, as well as in silico data, and even non-biological data such as empirical chemical properties, inventory information, etc.
For biological data, the protocol is a data template for the assay that is defined to capture raw data, normalization of data, additional calculations, conditions and lastly plate control layouts. Runs of protocols are individual experiments: each time you perform an experiment in the lab, create a run in the CDD protocol. We will discuss runs further when we are ready to import the data. If you perform the same assay for several projects, read how to share protocols between projects.
We will work with an example data-set (attached at the bottom of the lesson). Please note that this is an example based on published data, but does not accurately represent the published data, in case you were thinking of referencing this in your work.
The John's Hopkins Clinical Library was tested for inhibition of P. falciparum growth in 3 strains that differ in chloroquine sensitivity (3D7,Dd2,ItG) at two incubation periods of 48 and 96 hours. Inhibition was tested in-vitro at 10uM of drug.
Here is the methodology:
Synchronized ring stage parasites from chloroquine-sensitive 3D7 or multidrug resistant Dd2 or ItG were cultured in RPMI 1640 medium with 10% human serum and incubated for either 48 or 96 h in the presence of drug and [3H]-hypoxanthine1, 2. A 384 well plate with 0.2 mL of culture material per well at 0.2% parasitemia and 2-4% hematocrit. Percent inhibition is reported.
There are usually several ways in which assay data can be represented in database protocols, depending on how you plan to aggregate the data (calculate averages and such), and how you plan to search/mine it in the future. If you're unsure of the best design for your specific protocol, you can always contact your CDD account manager, or support directly.
With this in mind, here is a list of results and conditions we want to capture in this single-point protocol:
- Raw data (radioactive counts per minute)
- Primary result: % Inhibition calculated based on negative and positive controls
- Condition 1: Parasite Strain
- Condition 2: Incubation Time
We will import the raw CPM data together with control results and a plate map, and would like to calculate the % Inhibition. We also have to capture the two conditions: the strain and the time period. The rule of thumb is to create one protocol for each condition, so for our example this means a total of 6 protocols, one for each cell line at each time point. However, to minimize the number of protocols, we will create only three protocols, one for each cell line. The two time-points will become two separate readout definitions.
Let's start by creating a single protocol for the 3D7 strain.
Create a new protocol
If you have just logged into CDD, you are on the Explore Data page. Using the drop-down in the side-bar click the "Create a new..." button and choose "Protocol"
Fill in the Protocol name, the category, the description, project affiliation and any custom-defined Protocol fields available in your form. The best practice is to fill this in diligently, especially if you plan to share the data, or to remember what was done in a year or so. Of course you can edit this at a later time point as well, and/or add a link to e.g. a SOP or such, stored on your own servers. The project affiliation should be simple for now; you are working within the single default project with which your vault was created.
Don't forget to click "Create protocol" at the bottom of the form.
You are now taken to the "protocol details" page where you will continue to build out the protocol by creating readout definitions.
Readout definition
If you think of a protocol as an excel template, then the readout definition is a combination of a column header, formats, and the formula applied to values. It does not contain any data, but it will determine what types of data can be imported, and how these data are processed on import.
We are going to import raw CPM data for 48 and 96 hours, and calculate % Inhibitions based on the positive and negative controls for each:
In the "Create Readout Definition" form, as shown above, enter these values to add a readout for the CPM data at 48 hours:
| Name | CPM-48 |
| Data Type | Number |
| Display Format | 3 sig. figs. |
| Unit | CPM |
| Normalization | normalize within each plate (change the name to % Inhibition @ 48hr) |
Click "Save" to add this readout definition.
Now do the same for CPM at 96 hours:
| Name | CPM-96 |
| Data Type | Number |
| Display Format | 3 sig. figs. |
| Unit | CPM |
| Normalization | normalize within each plate (change the name to % Inhibition @ 96hr) |
Click on "Save", followed by "done editing". Is this what you have?
This is it, congratulations! You've created your first protocol. All that's left to do, is add a plate control layout and you'll be ready to import results. If not, click "edit readout definitions", then edit each of the two readouts until they do!
If you want to know more about the other options you saw while defining this protocol, please read this.
Plate control layout
You will need to define a plate layout that includes positive and negative controls in order to calculate % Inhibitions.
This may be done either before or after raw data import, and you may also choose to calculate % control instead of % of inhibition (you will need to update the readout definition to reflect this), in which case you only need one control.
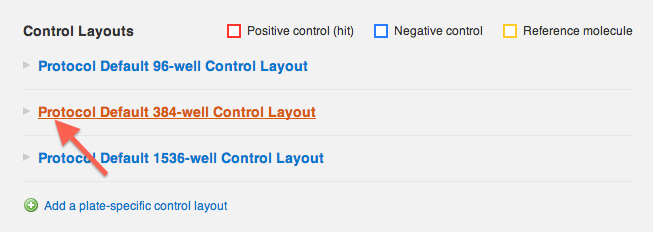
CDD Vault supports 96 well, 384 well and 1536 well plate formats.
A default layout is applied to all plates screened in the protocol, but layout over-rides exist for individual runs and individual plates. Here we describe the steps to create a protocol default layout that will be automatically assigned to any screened plate. If later on you decide on another layout for a specific run, just go to the Run Details page, and change the layout there.
On the Protocol Details page, scroll to the "Control layouts" section. Expand the plate format you wish to edit, and click "edit this layout".
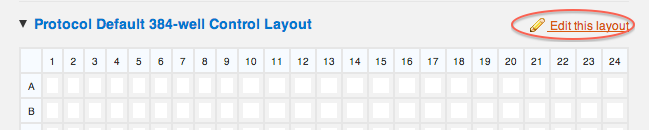
The layout is now interactive- when you click on any column or row header, or click on individual wells, a control state will be applied to them:
- 1 click on column 23 to mark it as a positive control
- 2 clicks on column 24 to mark it as a negative control.
Save changes at the bottom of the map, and this is what you should have:
If you want to learn more about setting control layouts at the run or plate level, read this article.
Import file preparation
You have already seen what an import file looks like in Lesson 2. The general guidelines are the same for any type of file import, such as: every data type must be in it's own column, there must be a column header on each column, etc. This article goes over import file preparation in detail.
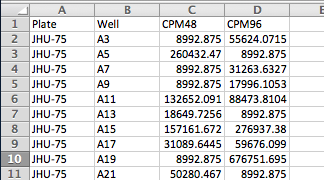
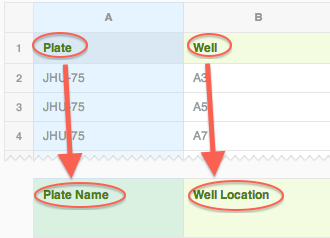
Here are the columns that we will import into our screening protocol. If you recall from Lesson 1, the column headers don't have to match CDD fields exactly, as there will be a mapping step between the file and the vault.
| File Header | Description |
|---|---|
| Plate | Screening plate name - already registered in Lesson 1 |
| Well | well location in the plate - already registered during Lesson 1 |
| CPM48 | Raw data column for 48 hour data |
| CPM96 | Raw data column for 96 hour data |
These are the only 4 columns we need, since the compound plate maps have already been registered during the initial library import in Lesson 2. In reality, you may be registering the screening plate at the same time you import the assay data. In this case you will also need to include a column (or columns) with molecule and batch IDs. If your instrument generated data in plate or matrix formats, we have created some helpful excel templates you can use to make the conversion to the CDD-importable format simpler.
Here's what the import file looks like. Include all wells even if they are blank. Make sure to save this excel file as CSV.
Click to download example file
Note: If you are not using Plates, these first 2 columns could just as easily be Entity ID and Batch ID (or 1 column that is the full EntityBatchID values).
File import steps
With a protocol and control layouts defined, and a raw data file prepared, it's time to start the import. The 3-step import wizard is going to be very familiar from Lesson 2.
Step 1: Choose data file
On the Import Data tab, upload your CSV import file and choose your project. Make sure to select the right project, or the protocol name will not be available for mapping in the next step.
Step 2: Map fields
Make sure that the "Add readouts (protocol data) only" option is selected.

Map the plate and well columns just like you did in Lesson 1. Make sure to click "Apply" after mapping each column.
| File Header | Import Mapping |
|---|---|
| Plate | Plate name in the "Plate and Well" section |
| Well | Well location in the "Plate and Well Section |
When a column in the file preview pane is highlighted, the CDD Vault will make an attempt to guess your mapping based on the provided file header. If the guess is correct, all you have to do, is click "apply". If the guess is not correct, change the mapping in the section below the file preview pane.
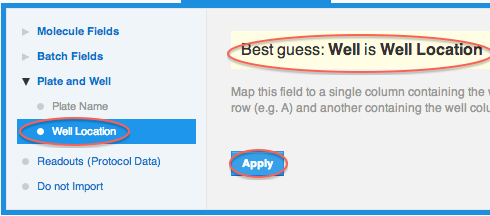
Here's what the mapping should look like so far:
Now it's time to map the assay raw data. All assay data is mapped under the "Readouts (Protocol Data)" section. When this is selected, there is a series of drop-downs that appear each time you make a selection.
| File Header | Import Mapping |
|---|---|
| CPM48 | Readouts (Protocol Data)-> Inhibition of 3D7 Growth-> CPM-48(CPM)-> Create a new run |
| CPM96 | Readouts (Protocol Data)-> Inhibition of 3D7 Growth-> CPM-96(CPM)-> Select run date |
Once the CPM48 column is selected, you will see that the default mapping choice in the mapper is set to "Do not import". This is because CDD Vault could not provide a best guess for the mapping. Change from "Do not import" to "Protocols (Readout Data)" option.
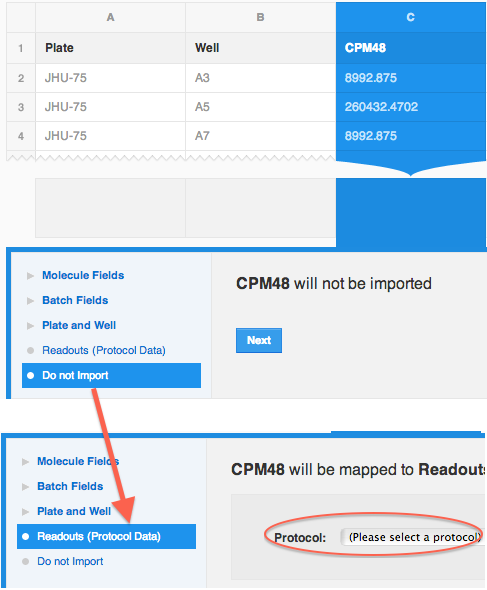
Notice the Protocol drop-down, and choose "Inhibition of 3D7".
Now choose " CPM-48 (CPM)" from the Readout definition drop-down.

Click on "Create a new run".
The data from our file is going to be added to a new run of a protocol. Runs are individual experiments: each time you perform an experiment in the lab, create a run in the protocol.
Runs are organized by date, and you may back-date it, if you are importing data several days after performing the actual experiment. The best practice is that the run date you add to your CDD Vault matches the experiment date in your lab notebook, because that keeps you and everyone else sane. Runs can be created any time before file import, but most often people like to create them as they import data, just like we are doing right now.
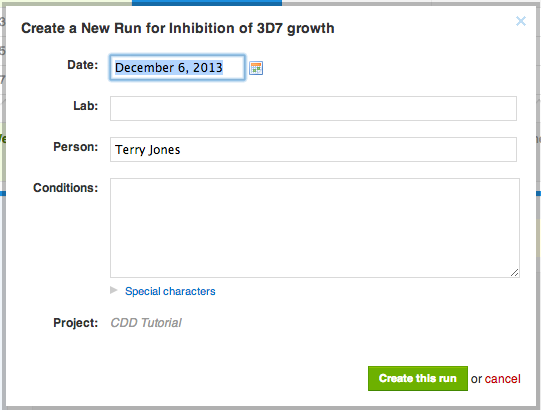
Click "Create this run", and then finalize the mapping by clicking "Apply".
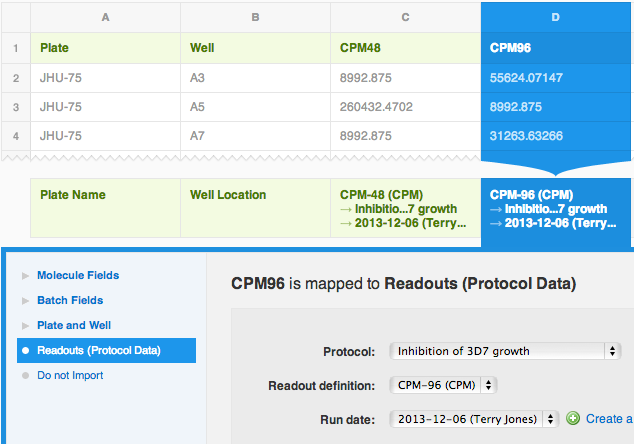
Once you are finished with column CPM48, repeat the steps for CPM96. This time you will not create a new run, but select the one you just created for the run date drop-down- we want to keep these data coupled (even though we realize that 48 hours and 96 hours after the start of the experiment probably happened on different days.) Partitioning of data into different runs is entirely up to you, based on whatever makes the most scientific sense. This is one of the instances where more than one way of organizing data in the database is possible. If you're not sure what's best, feel free to reach out to support.
Here's what the final mapping should look like. Of course the run date and the user's name will be different.
Click this button: 
Step 3
The initial import has started when you clicked "Process File". The yellow progress bar at the top will give an indication how the initial import is progressing. Once the initial stage is completed, you will see a QC or import validation report. This report has already appeared in Lesson 1, and as before, make sure to review it carefully, as it will give you clues is something is wrong. At this stage the data have not been written into your vault, and you may simply "reject" or cancel the entire import, or any of the events you see. Once the file is "committed", it means the import is finalized and it is more difficult to undo (though not impossible).
For example, you should see 1920 records being added. This includes all of the wells on 5 384 well plates. If you see some other number, or errors or suspicious events, there are problems with the import, and you may want to reject it.
If everything went according to plan, here's what your validation report should look like:
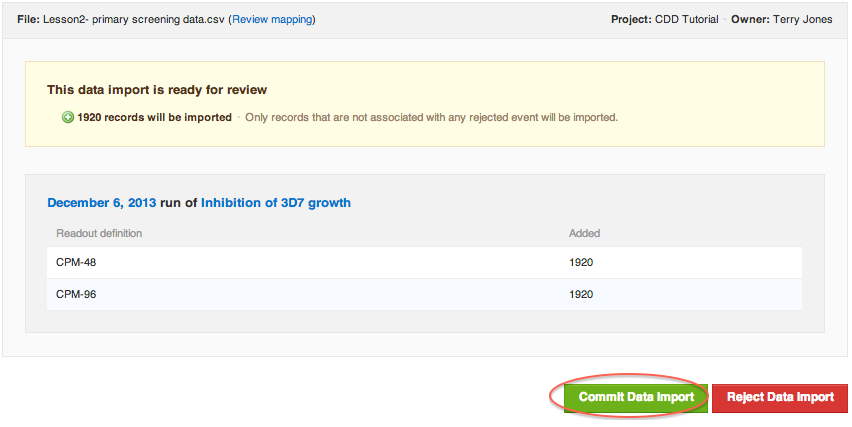
If in doubt: REJECT. You can always start the import again without much work, but it may take some work to delete all of the erroneously entered data after it's committed.
If your import validation report looks the same as the screen-shot above, click "Commit Data Import".
TIP: You do not need to stay at your computer, or even logged into CDD while the initial import or final import is happening. Click on the "e-mail update" link in the yellow status bar to receive an e-mail alert when your file is ready for the next step.
When the commit step is finished, the import report will update one more time, providing quick links to review, QC or visualize the data.
Data QC and review
When the import is finished, the validation report page will update with hyperlinks to review the data which was just imported.
- Explore imported data link will take you directly to the SAR table showing molecule structures and assay results
- Run date (e.g. "December 6, 2013") will take you to QC the plate data - we recommend this as your first step.
- Protocol name (e.g. "Inhibition of 3D7 growth") will take you to the protocol overview which shows all runs
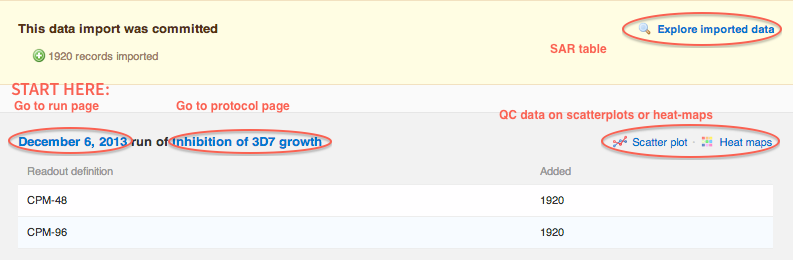
The best practice is to go to start with quality control (QC) of plates on the Run page, Data summary tab. You will have another opportunity to view heat-maps and scatter-plots on this page.
You also have the Run details tab, where you can change the plate layouts if they differ from the automatically applied protocol default layouts. You can also delete the entire run on this page.
Individual data points may be edited or delete on the All data tab.
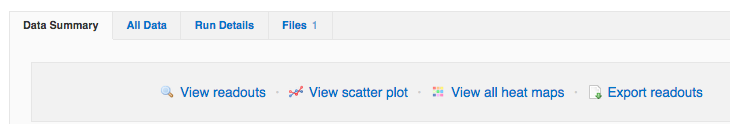
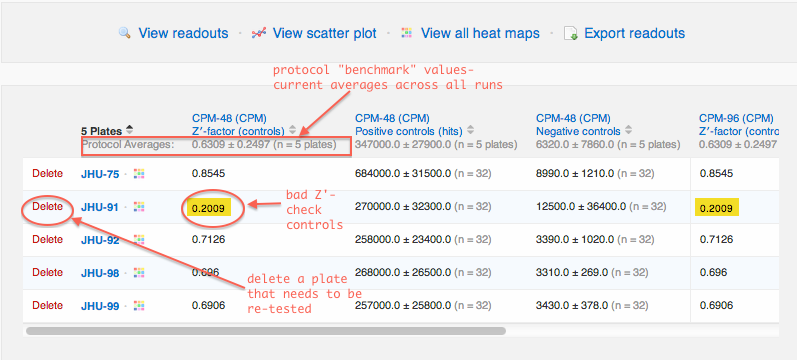
The Data Summary tab is designed for plate quality control review, before jumping into structure-activity analysis:
- Review plate Z' factors. CDD highlights Z' factors that are out of normal range.
- Review control data with averages per plate.
- Compare controls with protocol benchmark averages (the grey numbers beneath each column header.)
- Delete data from plates that need to be re-run.
Lesson Summary
This is the last lesson of the introductory tutorial. In this lesson, we have learned to create protocols for single point assay data. We looked at plate control layouts within protocols, and runs of protocols. We prepared an import file, and uploaded assay data. We looked at plate quality control. If you've gone through all 3 lessons, you should be able to perform the main tasks related to getting data into your CDD Vault. For more advanced topics, check out other sections of the Knowledge Base, e.g.:
- Concentration-Response Curves and IC50 calculation
- Searching and mining data for structure-activity relationships
- Exporting data from CDD Vault
- Advanced calculations, QSAR modeling, and visualization with CDD Vision